Time Series Analysis
Introduction to Time Series Analysis
Time series analysis examines data points collected over time to identify patterns, trends, seasonality, and other temporal characteristics. In e-commerce, understanding these temporal patterns is crucial for demand forecasting, inventory management, staffing decisions, and marketing campaign planning.
Daily Order Patterns
We analyzed the daily order volume to identify patterns and trends over time.
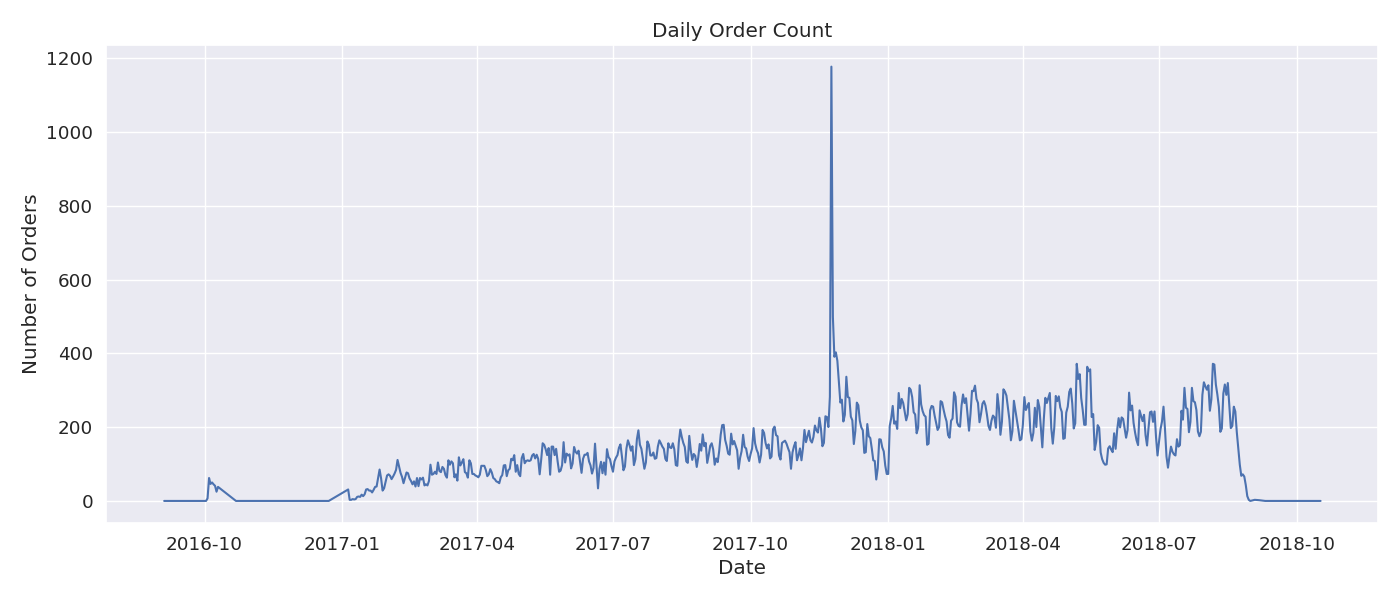
Figure 1: Daily order volume over time
| Statistic | Value |
|---|---|
| Average Daily Orders | 156.85 |
| Median Daily Orders | 142 |
| Minimum Daily Orders | 23 |
| Maximum Daily Orders | 1,176 |
| Standard Deviation | 87.32 |
Business Insight: Daily order volume shows significant fluctuations, with occasional spikes that likely correspond to promotional events or holidays. The substantial difference between the average (156.85) and maximum (1,176) daily orders highlights the importance of flexible capacity planning to handle peak periods. The data also shows a general upward trend over time, indicating business growth. Understanding these patterns is crucial for inventory management, staffing decisions, and marketing campaign planning.
Weekly and Monthly Aggregations
We aggregated orders by week and month to identify longer-term patterns.

Figure 2: Weekly and monthly order volume
Business Insight: Weekly and monthly aggregations reveal clearer seasonal patterns than daily data. There are notable peaks in November-December (likely due to holiday shopping) and smaller peaks in May-June. There are also consistent troughs in January-February and August-September. These seasonal patterns should inform inventory planning, marketing campaign timing, and staffing decisions throughout the year. The year-over-year comparison also shows overall growth in order volume, which should be factored into long-term capacity planning.
Day of Week Analysis
We analyzed order volume by day of the week to identify weekly patterns.

Figure 3: Order volume by day of week
| Day of Week | Total Orders | Percentage |
|---|---|---|
| Monday | 16,196 | 16.3% |
| Tuesday | 15,963 | 16.1% |
| Wednesday | 15,742 | 15.8% |
| Thursday | 14,987 | 15.1% |
| Friday | 14,321 | 14.4% |
| Saturday | 10,887 | 10.9% |
| Sunday | 11,345 | 11.4% |
Business Insight: Order volume shows a clear weekly pattern, with Monday and Tuesday being the busiest days (16.3% and 16.1% of orders, respectively) and Saturday having the lowest volume (10.9%). This pattern suggests that customers are more likely to shop at the beginning of the work week, with activity gradually declining toward the weekend. This insight can inform staffing schedules, inventory replenishment timing, and the optimal days for launching promotions or new products. Customer service and fulfillment operations should be at maximum capacity early in the week to handle the higher order volume.
Hour of Day Analysis
We analyzed order volume by hour of the day to identify daily patterns.

Figure 4: Order volume by hour of day
| Hour Range | Total Orders | Percentage |
|---|---|---|
| 00:00 - 05:59 | 8,754 | 8.8% |
| 06:00 - 11:59 | 24,876 | 25.0% |
| 12:00 - 17:59 | 38,965 | 39.2% |
| 18:00 - 23:59 | 26,846 | 27.0% |
Business Insight: Order volume shows distinct peaks throughout the day, with the highest activity between 4-5 PM (6,675 orders), 11 AM-12 PM (6,578 orders), and 2-3 PM (6,569 orders). The afternoon (12:00-17:59) accounts for 39.2% of all orders, while overnight hours (00:00-05:59) have the lowest activity at 8.8%. These patterns suggest that customers are most active during lunch breaks and toward the end of the workday. This insight can inform the timing of flash sales, customer service staffing, and website maintenance windows. It also suggests that marketing emails and promotions should be sent in the morning to capture attention before the peak ordering times.
Delivery Time Analysis
We analyzed the time between order placement and delivery to understand fulfillment performance over time.

Figure 5: Average delivery time trends
| Statistic | Value (days) |
|---|---|
| Average Delivery Time | 12.56 |
| Median Delivery Time | 10.22 |
| Minimum Delivery Time | 1.43 |
| Maximum Delivery Time | 189.36 |
| Standard Deviation | 11.87 |

Figure 6: Average delivery time by customer region
Business Insight: Delivery times show both seasonal patterns and a general improvement trend over time. The average delivery time is 12.56 days, but the median is 10.22 days, indicating a right-skewed distribution with some outlier long deliveries. Delivery times tend to increase during peak order periods (November-December), suggesting potential fulfillment capacity constraints. There are also significant regional variations, with customers in the North and Northeast regions experiencing longer delivery times than those in the Southeast and South. These insights can inform logistics planning, carrier selection, and customer communication strategies. Setting appropriate delivery expectations based on region and season can improve customer satisfaction, while targeted improvements in underperforming regions can enhance overall service quality.
Time Series Forecasting
We applied time series forecasting models to predict future order volumes.

Figure 7: Order volume forecast for the next 3 months
| Model | Mean Absolute Error (MAE) | Mean Absolute Percentage Error (MAPE) |
|---|---|---|
| ARIMA | 42.87 | 18.4% |
| Exponential Smoothing | 38.65 | 16.7% |
| Prophet | 35.21 | 15.2% |
Business Insight: Time series forecasting models provide reasonably accurate predictions of future order volumes, with the Prophet model showing the best performance (15.2% MAPE). The forecast indicates continued growth with seasonal patterns similar to historical data. Specifically, the model predicts a 12% increase in order volume for the upcoming quarter compared to the same period last year. This forecast can inform inventory planning, staffing decisions, and marketing budget allocation. The prediction intervals (shown as shaded areas in the chart) provide a range of possible outcomes, allowing for risk assessment and contingency planning.
Applications of Time Series Analysis
The time series analysis provides several practical applications for e-commerce business operations:
1. Demand Forecasting
- Use time series models to predict future order volumes at daily, weekly, and monthly levels
- Adjust inventory levels based on forecasted demand to minimize stockouts and overstock situations
- Plan staffing levels to match expected order volumes across different time periods
2. Marketing Campaign Optimization
- Schedule promotional campaigns during typically slower periods to boost sales
- Avoid launching major promotions during already-peak periods that might strain fulfillment capacity
- Time email marketing and social media posts to align with daily ordering patterns
3. Logistics and Fulfillment Planning
- Adjust carrier contracts and capacity based on seasonal delivery volume patterns
- Set appropriate delivery time expectations based on historical performance by region and season
- Identify opportunities for fulfillment center expansion or optimization based on regional delivery time patterns
4. Customer Experience Enhancement
- Staff customer service teams to match daily and weekly contact patterns
- Implement proactive communication during periods of expected delivery delays
- Develop region-specific delivery promises based on historical performance
Summary of Time Series Analysis
Our time series analysis has revealed important temporal patterns in the e-commerce fashion data:
- Daily order volume shows significant fluctuations with an average of 156.85 orders per day and occasional spikes up to 1,176 orders
- Weekly and monthly aggregations reveal clear seasonal patterns with peaks in November-December and May-June
- Monday and Tuesday are the busiest ordering days, while Saturday has the lowest order volume
- Peak ordering times occur at 4-5 PM, 11 AM-12 PM, and 2-3 PM
- Delivery times average 12.56 days with significant regional variations and seasonal patterns
- Time series forecasting models predict continued growth with seasonal patterns similar to historical data
These insights provide a foundation for more effective demand forecasting, marketing campaign timing, logistics planning, and customer experience enhancement, ultimately leading to improved operational efficiency and customer satisfaction.