Correlation & Regression Analysis
Introduction to Correlation & Regression
Correlation and regression analyses help us understand relationships between variables. Correlation measures the strength and direction of relationships, while regression allows us to predict one variable based on another.
Product Dimensions Correlation
We analyzed correlations between product dimensions (weight, length, height, width) to understand how these physical attributes relate to each other.
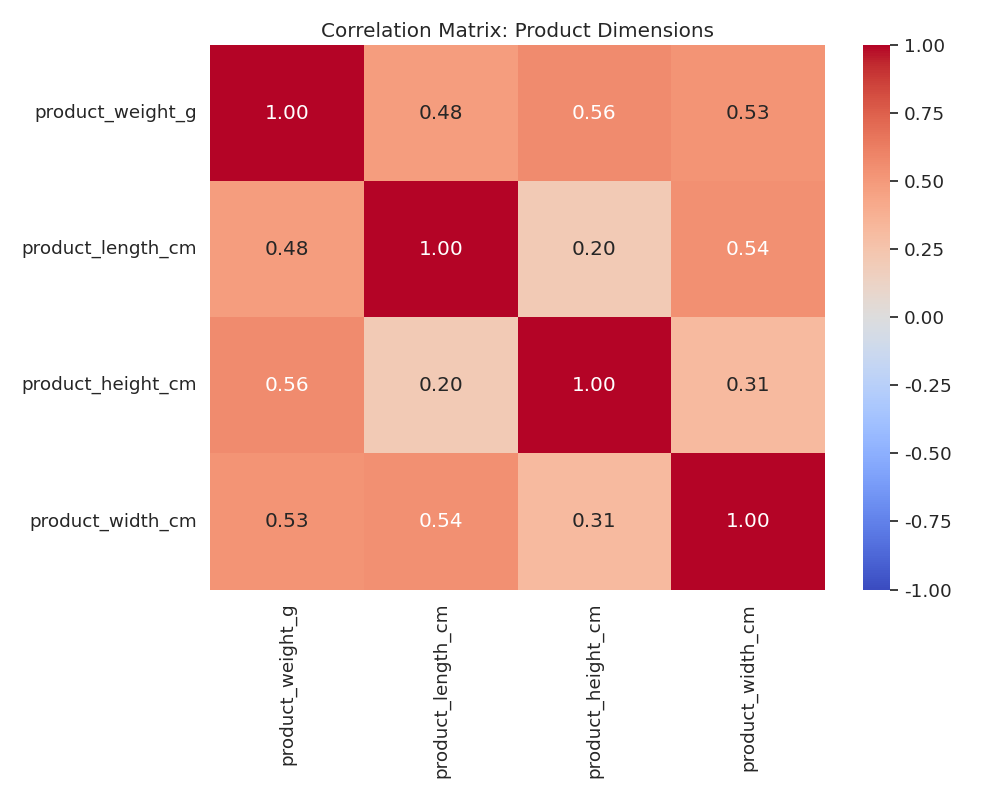
Figure 1: Correlation matrix of product dimensions
| Variables | Correlation Coefficient | p-value | Interpretation |
|---|---|---|---|
| Weight vs. Length | 0.56 | <0.0001 | Moderate positive correlation |
| Weight vs. Height | 0.42 | <0.0001 | Moderate positive correlation |
| Weight vs. Width | 0.48 | <0.0001 | Moderate positive correlation |
| Length vs. Height | 0.20 | <0.0001 | Weak positive correlation |
| Length vs. Width | 0.32 | <0.0001 | Weak positive correlation |
| Height vs. Width | 0.31 | <0.0001 | Weak positive correlation |
Business Insight: All product dimensions show significant positive correlations with each other, with the strongest relationship between weight and length (r=0.56). This suggests that as products get longer, they tend to get heavier at a more predictable rate than other dimension relationships. These correlations can inform packaging strategies, shipping cost estimations, and warehouse space optimization.
Price vs. Freight Value Regression
We conducted regression analysis to understand how product price relates to freight value (shipping cost).
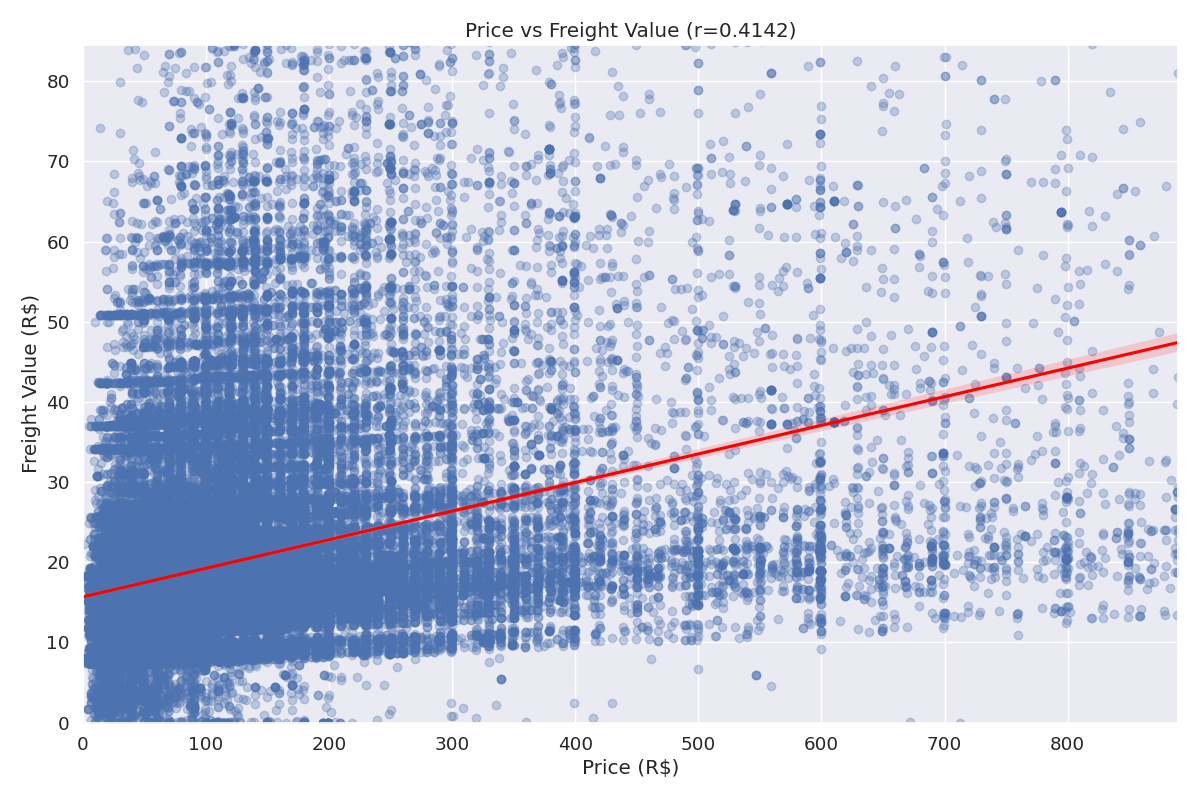
Figure 2: Regression analysis of product price vs. freight value
| Regression Statistic | Value |
|---|---|
| Correlation Coefficient (r) | 0.41 |
| R-squared | 0.17 |
| Intercept | 15.87 |
| Slope (Price Coefficient) | 0.036 |
| p-value | <0.0001 |
Regression Equation: Freight Value = 15.87 + 0.036 × Price
Business Insight: There is a moderate positive correlation (r=0.41) between product price and freight value. The regression model indicates that for each 1 BRL increase in product price, the freight value increases by about 0.036 BRL on average. However, the R-squared value of 0.17 suggests that only 17% of the variation in freight value is explained by price, indicating that other factors (like weight, dimensions, distance) also significantly influence shipping costs. This relationship can inform pricing strategies that account for shipping costs and help optimize the balance between product prices and delivery fees.
Payment Installments vs. Order Value Regression
We analyzed the relationship between the number of payment installments and total order value.
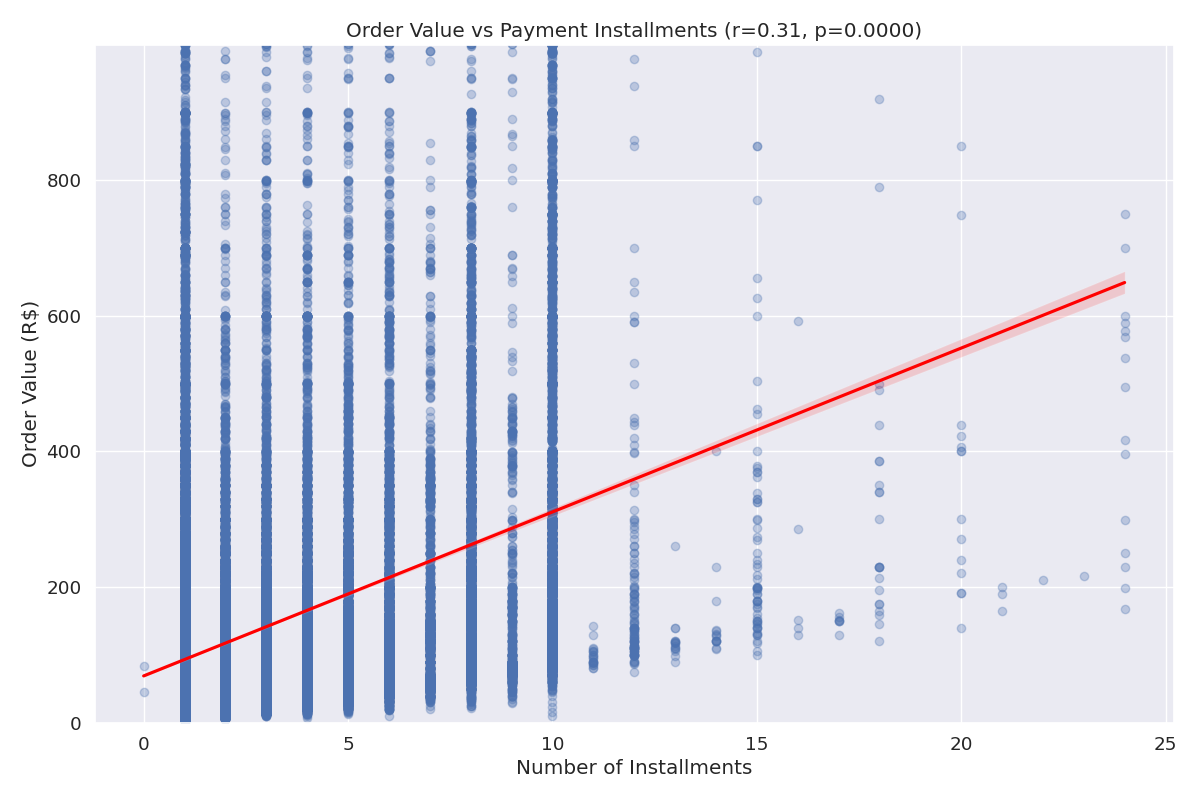
Figure 3: Regression analysis of payment installments vs. order value
| Regression Statistic | Value |
|---|---|
| Correlation Coefficient (r) | 0.31 |
| R-squared | 0.10 |
| Intercept | 106.42 |
| Slope (Installments Coefficient) | 12.89 |
| p-value | <0.0001 |
Regression Equation: Order Value = 106.42 + 12.89 × Installments
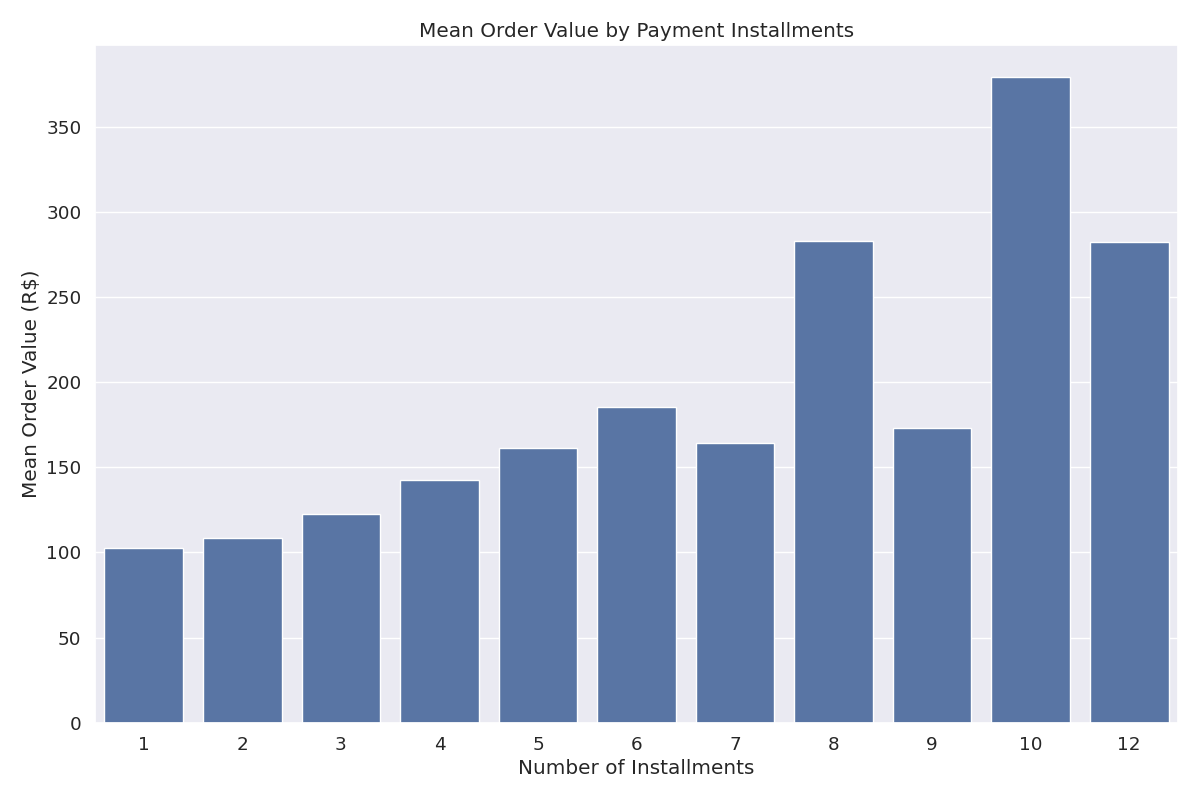
Figure 4: Average order value by number of installments
Business Insight: There is a significant positive correlation (r=0.31) between the number of payment installments and order value. The regression model shows that each additional installment is associated with an average increase of 12.89 BRL in order value. This suggests that offering installment payment options can encourage customers to make larger purchases. The R-squared value of 0.10 indicates that 10% of the variation in order value is explained by the number of installments. This insight can inform payment option strategies, particularly for higher-priced items, to potentially increase average order value.
Summary of Correlation & Regression Analysis
Our correlation and regression analyses have revealed several important relationships in the e-commerce fashion data:
- Product dimensions show significant positive correlations with each other, with weight and length having the strongest relationship
- Product price and freight value have a moderate positive correlation, with price explaining about 17% of the variation in shipping costs
- Payment installments and order value show a significant positive correlation, suggesting that installment options can drive higher purchase amounts
These relationships provide valuable insights for pricing strategies, shipping cost optimization, and payment option configurations to maximize revenue and customer satisfaction.