Inferential Statistics Analysis
Introduction to Inferential Statistics
While descriptive statistics summarize our data, inferential statistics allow us to make predictions and draw conclusions about the larger population based on our sample data. This analysis includes confidence intervals, hypothesis testing, and statistical significance assessments.
Confidence Interval for Mean Order Value
We calculated a 95% confidence interval for the mean order value to estimate the true average order value in the population.
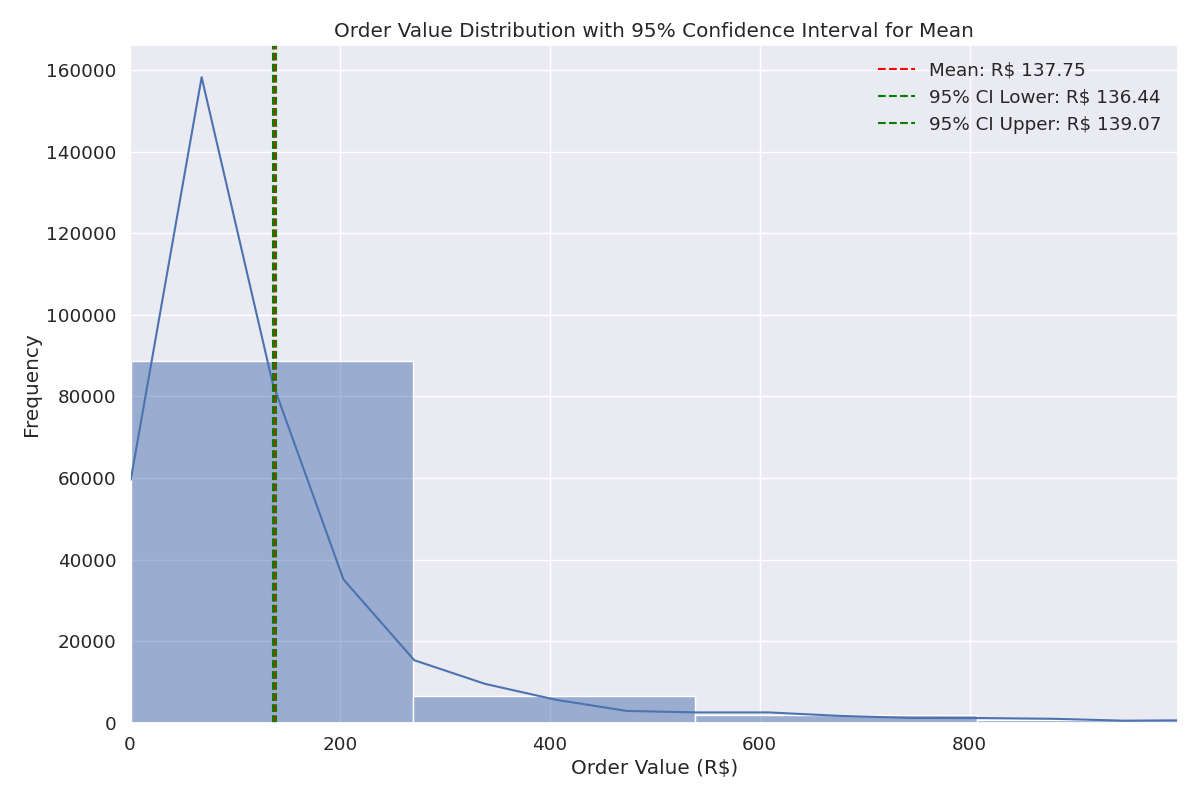
Figure 1: 95% Confidence Interval for Mean Order Value
| Statistic | Value (BRL) |
|---|---|
| Sample Mean | R$137.76 |
| Standard Error | R$0.67 |
| 95% Confidence Interval Lower Bound | R$136.44 |
| 95% Confidence Interval Upper Bound | R$139.07 |
Business Insight: With 95% confidence, we can state that the true mean order value for all e-commerce fashion orders is between R$136.44 and R$139.07. This narrow confidence interval indicates high precision in our estimate, providing a reliable benchmark for pricing strategies and revenue forecasting.
Hypothesis Testing: Order Value by Payment Type
We conducted hypothesis testing to determine if there are significant differences in order values between different payment types.
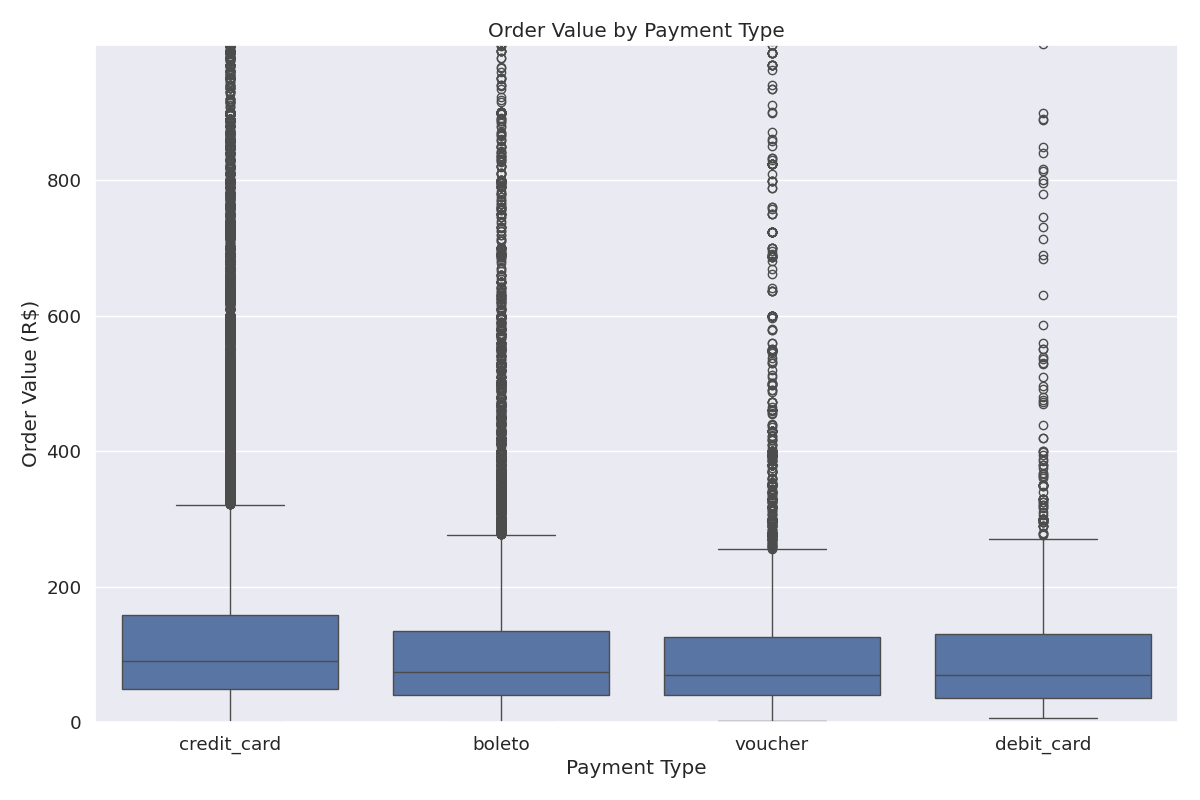
Figure 2: Mean Order Value by Payment Type with 95% Confidence Intervals
| Payment Type | Mean Order Value (BRL) | 95% CI Lower | 95% CI Upper |
|---|---|---|---|
| Credit Card | R$143.87 | R$142.31 | R$145.43 |
| Boleto | R$120.68 | R$117.89 | R$123.47 |
| Voucher | R$116.89 | R$110.42 | R$123.36 |
| Debit Card | R$127.85 | R$117.26 | R$138.44 |
ANOVA Results: F-statistic = 79.93, p-value < 0.0001
Business Insight: There is a statistically significant difference in order values between payment types (p < 0.0001). Credit card payments have the highest average order value (R$143.87), significantly higher than boleto (R$120.68) and voucher (R$116.89) payments. This suggests that customers using credit cards tend to make larger purchases, possibly due to the ability to pay in installments. This insight can inform payment method promotions and checkout optimization strategies.
Hypothesis Testing: Order Value by Customer State
We analyzed whether there are significant differences in order values across different Brazilian states.
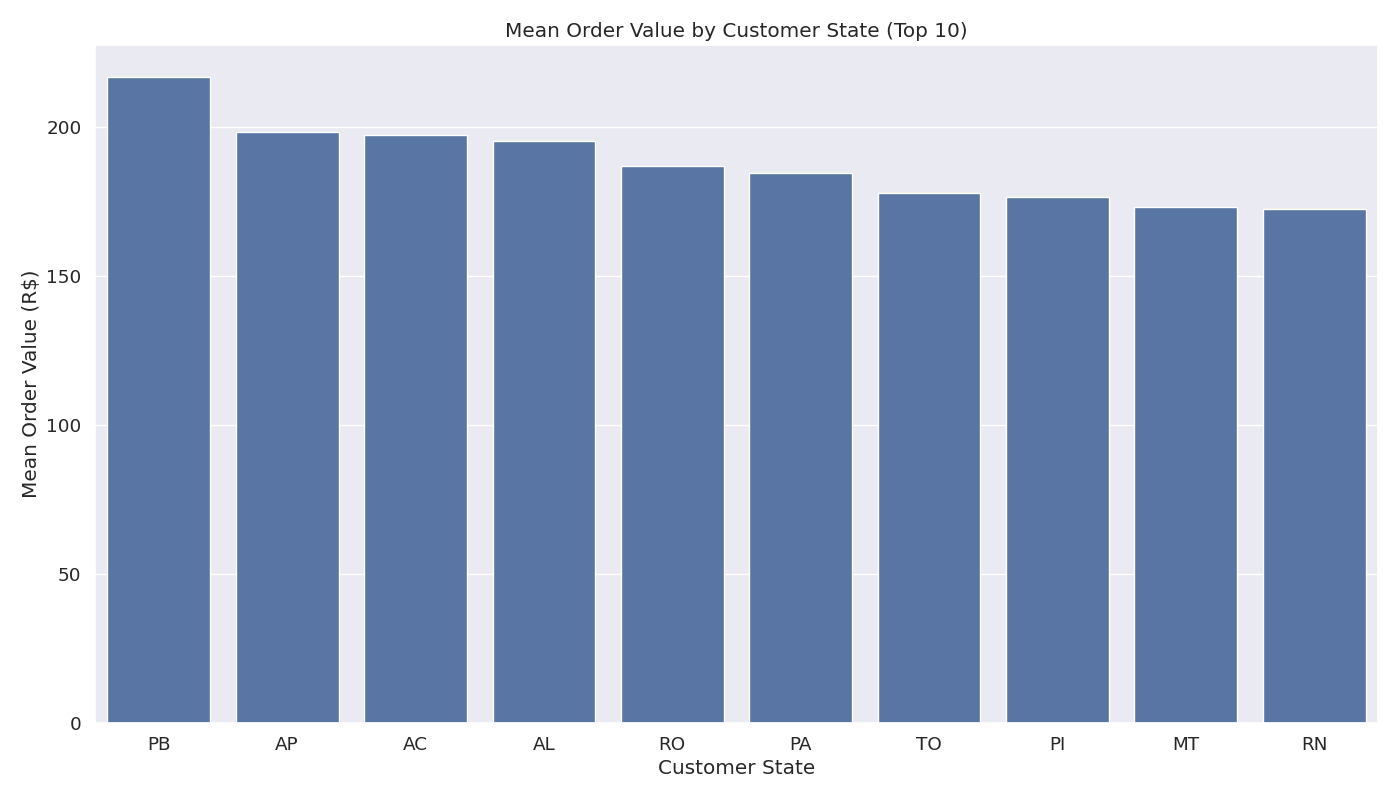
Figure 3: Mean Order Value by Top Customer States with 95% Confidence Intervals
| State | Mean Order Value (BRL) | 95% CI Lower | 95% CI Upper |
|---|---|---|---|
| SP | R$136.92 | R$134.76 | R$139.08 |
| RJ | R$138.48 | R$134.27 | R$142.69 |
| MG | R$134.76 | R$130.55 | R$138.97 |
| RS | R$142.53 | R$136.84 | R$148.22 |
| PR | R$139.87 | R$134.18 | R$145.56 |
| PB | R$216.67 | R$183.24 | R$250.10 |
ANOVA Results: F-statistic = 3.92, p-value < 0.0001
Business Insight: There are statistically significant differences in order values between customer states (p < 0.0001). Notably, PB (Paraíba) shows a much higher average order value (R$216.67) compared to other states, though with wider confidence intervals due to smaller sample size. This geographic variation suggests opportunities for region-specific marketing strategies and pricing adjustments to optimize revenue across different markets.
Correlation Analysis: Payment Installments and Order Value
We examined the relationship between the number of payment installments and order value to understand customer payment behaviors.
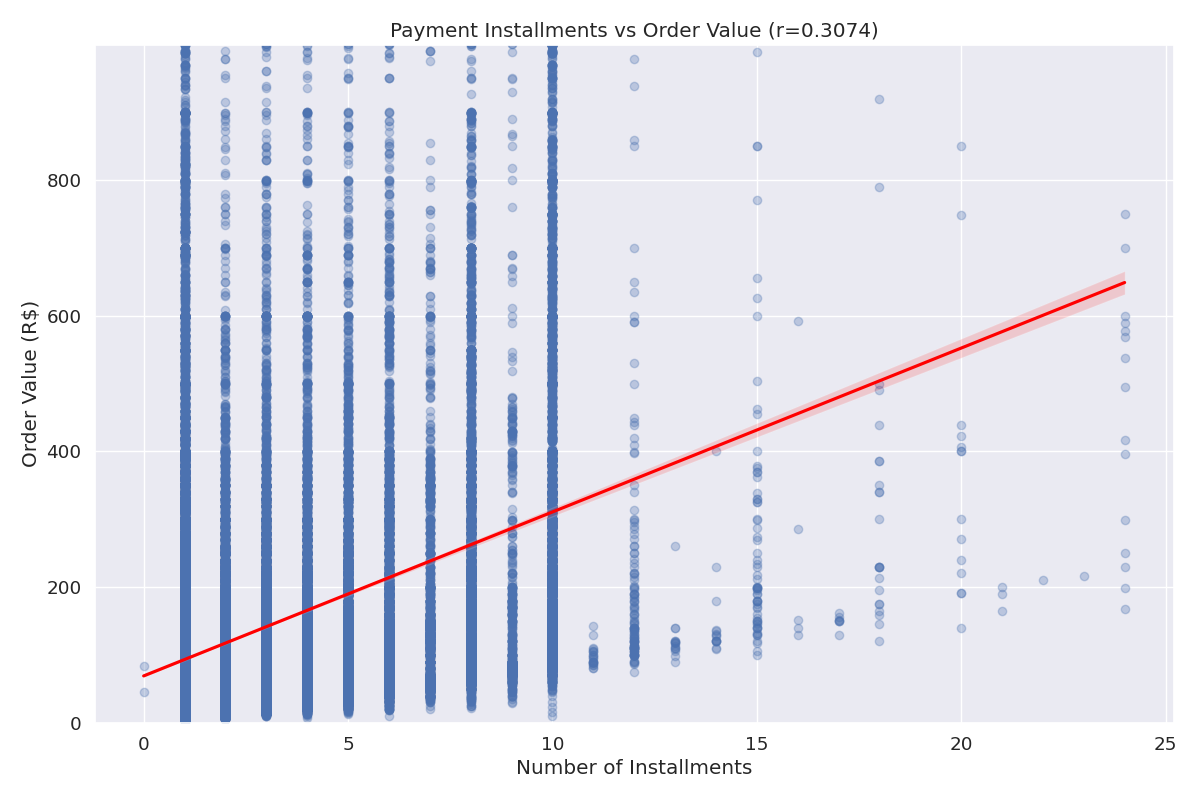
Figure 4: Relationship between Payment Installments and Order Value
Correlation Results: Pearson correlation coefficient = 0.31, p-value < 0.0001
Business Insight: There is a statistically significant positive correlation (r = 0.31, p < 0.0001) between the number of payment installments and order value. This indicates that customers tend to use more installments for higher-value purchases, likely to manage cash flow. This insight can inform installment plan offerings and promotional strategies, particularly for higher-priced items.
Summary of Inferential Statistics
Our inferential analysis has revealed several statistically significant patterns in the e-commerce fashion data:
- The true mean order value is between R$136.44 and R$139.07 with 95% confidence
- Payment types significantly affect order values, with credit card users spending more on average
- Geographic location (customer state) significantly influences order values
- There is a significant positive correlation between payment installments and order value
These statistical inferences provide a solid foundation for data-driven business decisions and strategy development.