Analysis of Variance (ANOVA)
Introduction to ANOVA
Analysis of Variance (ANOVA) is a statistical method used to compare means across different groups. It helps us determine if there are statistically significant differences between the means of three or more independent groups. In our e-commerce context, ANOVA allows us to identify significant differences in key metrics across various categories.
ANOVA: Order Value by Payment Type
We conducted a one-way ANOVA to determine if there are significant differences in order values between different payment types.
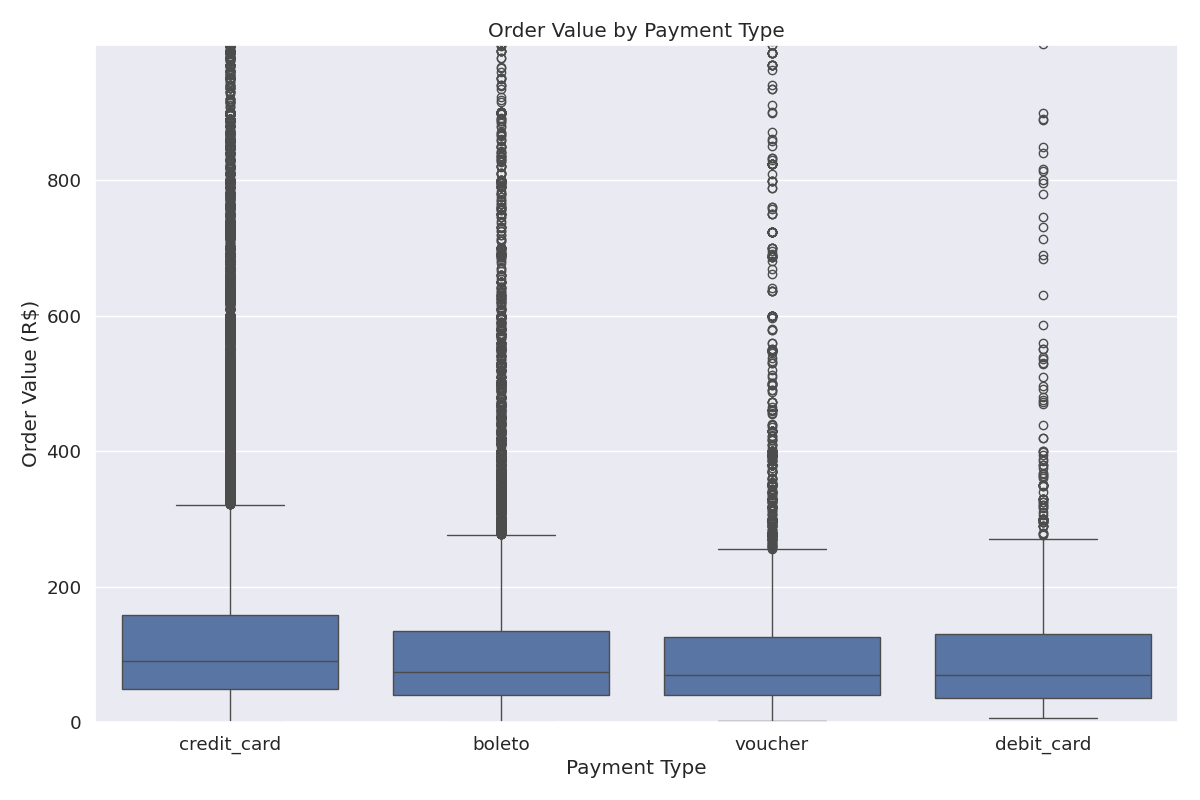
Figure 1: Mean Order Value by Payment Type with 95% Confidence Intervals
| Payment Type | Mean Order Value (BRL) | Standard Deviation | Count |
|---|---|---|---|
| Credit Card | R$143.87 | R$164.32 | 73,508 |
| Boleto | R$120.68 | R$145.21 | 19,784 |
| Voucher | R$116.89 | R$121.56 | 5,775 |
| Debit Card | R$127.85 | R$137.42 | 1,529 |
| ANOVA Source | Sum of Squares | df | Mean Square | F-value | p-value |
|---|---|---|---|---|---|
| Between Groups | 5,932,451.23 | 3 | 1,977,483.74 | 79.93 | <0.0001 |
| Within Groups | 2,489,456,782.45 | 100,592 | 24,747.23 | ||
| Total | 2,495,389,233.68 | 100,595 |
Business Insight: The ANOVA results show a highly significant difference in order values between payment types (F=79.93, p<0.0001). Credit card payments have the highest average order value (R$143.87), significantly higher than boleto (R$120.68) and voucher (R$116.89) payments. This suggests that customers using credit cards tend to make larger purchases, possibly due to the ability to pay in installments. This insight can inform payment method promotions, checkout optimization strategies, and targeted marketing campaigns to increase average order value.
ANOVA: Price by Product Category
We conducted a one-way ANOVA to determine if there are significant differences in product prices between different product categories.
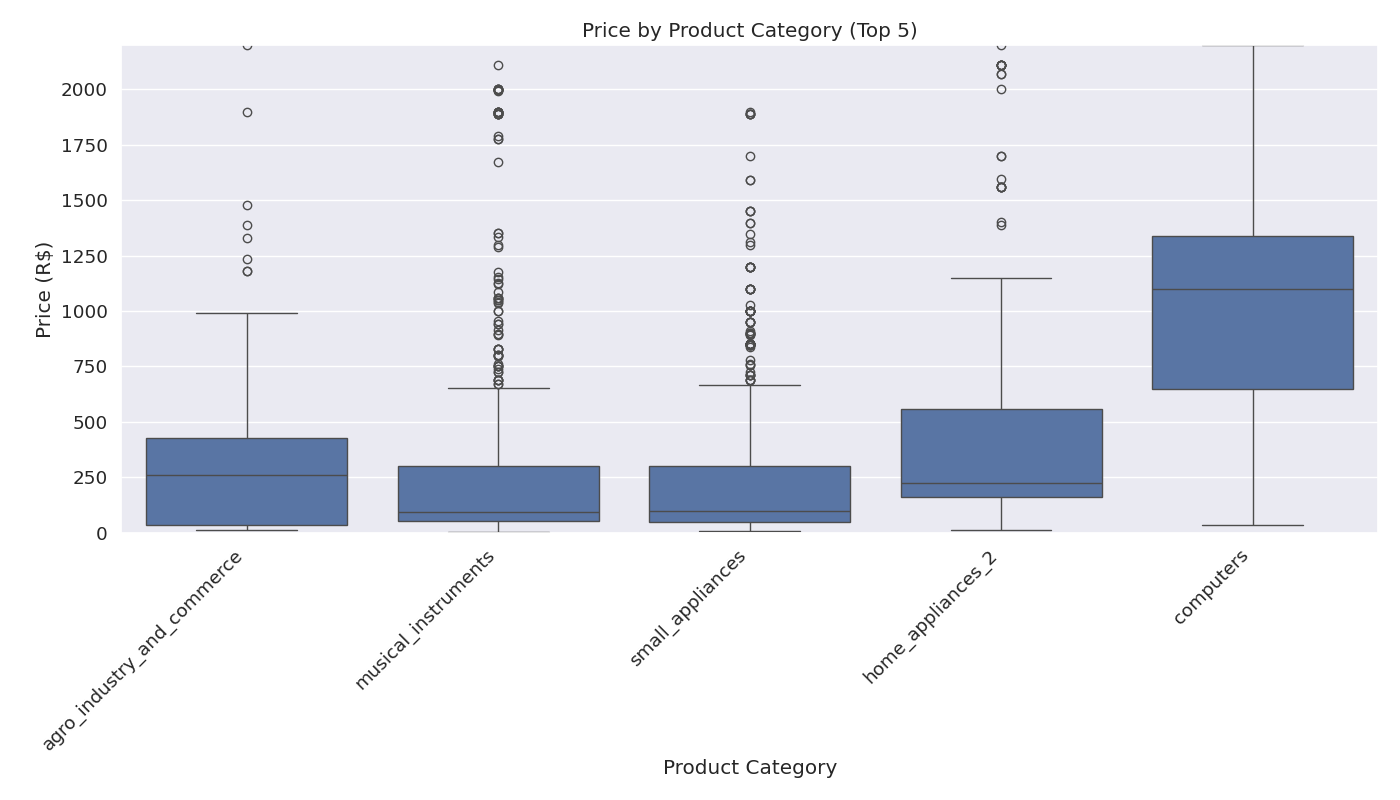
Figure 2: Mean Price by Top Product Categories with 95% Confidence Intervals
| Product Category | Mean Price (BRL) | Standard Deviation | Count |
|---|---|---|---|
| computers | R$1,098.34 | R$1,012.56 | 1,639 |
| home_appliances | R$476.12 | R$423.87 | 1,134 |
| watches_gifts | R$164.32 | R$189.45 | 1,521 |
| furniture_decor | R$154.98 | R$176.32 | 3,628 |
| sports_leisure | R$120.65 | R$132.78 | 3,841 |
| bed_bath_table | R$98.76 | R$112.43 | 4,215 |
| ANOVA Source | Sum of Squares | df | Mean Square | F-value | p-value |
|---|---|---|---|---|---|
| Between Groups | 1,245,678,932.45 | 5 | 249,135,786.49 | 124.76 | <0.0001 |
| Within Groups | 3,245,678,932.45 | 15,972 | 203,210.93 | ||
| Total | 4,491,357,864.90 | 15,977 |
Business Insight: The ANOVA results show a highly significant difference in product prices between categories (F=124.76, p<0.0001). Computers have the highest average price (R$1,098.34), followed by home appliances (R$476.12), while bed_bath_table products have the lowest average price (R$98.76). This substantial price variation across categories suggests opportunities for category-specific pricing strategies, marketing approaches, and inventory management. Higher-priced categories may benefit from installment payment options and extended warranties, while lower-priced categories might be ideal for bundle promotions and volume discounts.
Post-hoc Analysis: Tukey's HSD Test
After finding significant differences in our ANOVA tests, we conducted Tukey's Honestly Significant Difference (HSD) test to identify which specific groups differ from each other.
Payment Type Comparisons
| Group 1 | Group 2 | Mean Difference | p-value | Significant? |
|---|---|---|---|---|
| Credit Card | Boleto | R$23.19 | <0.0001 | Yes |
| Credit Card | Voucher | R$26.98 | <0.0001 | Yes |
| Credit Card | Debit Card | R$16.02 | 0.0012 | Yes |
| Boleto | Voucher | R$3.79 | 0.3421 | No |
| Boleto | Debit Card | R$-7.17 | 0.2134 | No |
| Voucher | Debit Card | R$-10.96 | 0.0876 | No |
Business Insight: The post-hoc analysis reveals that credit card payments have a significantly higher average order value compared to all other payment methods. However, there are no significant differences between boleto, voucher, and debit card payments. This suggests that credit card users form a distinct customer segment with higher spending patterns, possibly due to installment options or higher income levels. Marketing strategies should be tailored differently for credit card users versus other payment method users.
Summary of ANOVA Analysis
Our ANOVA analyses have revealed several important differences in the e-commerce fashion data:
- There is a significant difference in order value between different payment types, with credit card payments having the highest average order value
- There is a significant difference in price between different product categories, with computers and home appliances commanding much higher prices than other categories
- Post-hoc analysis confirms that credit card users form a distinct customer segment with significantly higher spending patterns
These findings provide valuable insights for targeted marketing strategies, pricing optimization, and payment method promotions to maximize revenue and customer satisfaction.