Descriptive Statistics Analysis
Dataset Overview
Our analysis is based on the Olist e-commerce dataset, focusing on fashion products. The dataset contains:
- 32,951 products across various categories
- 99,441 orders
- 3,095 sellers
- Customer data from across Brazil
Product Categories
The dataset includes products from various categories, with fashion-related categories being a significant portion.
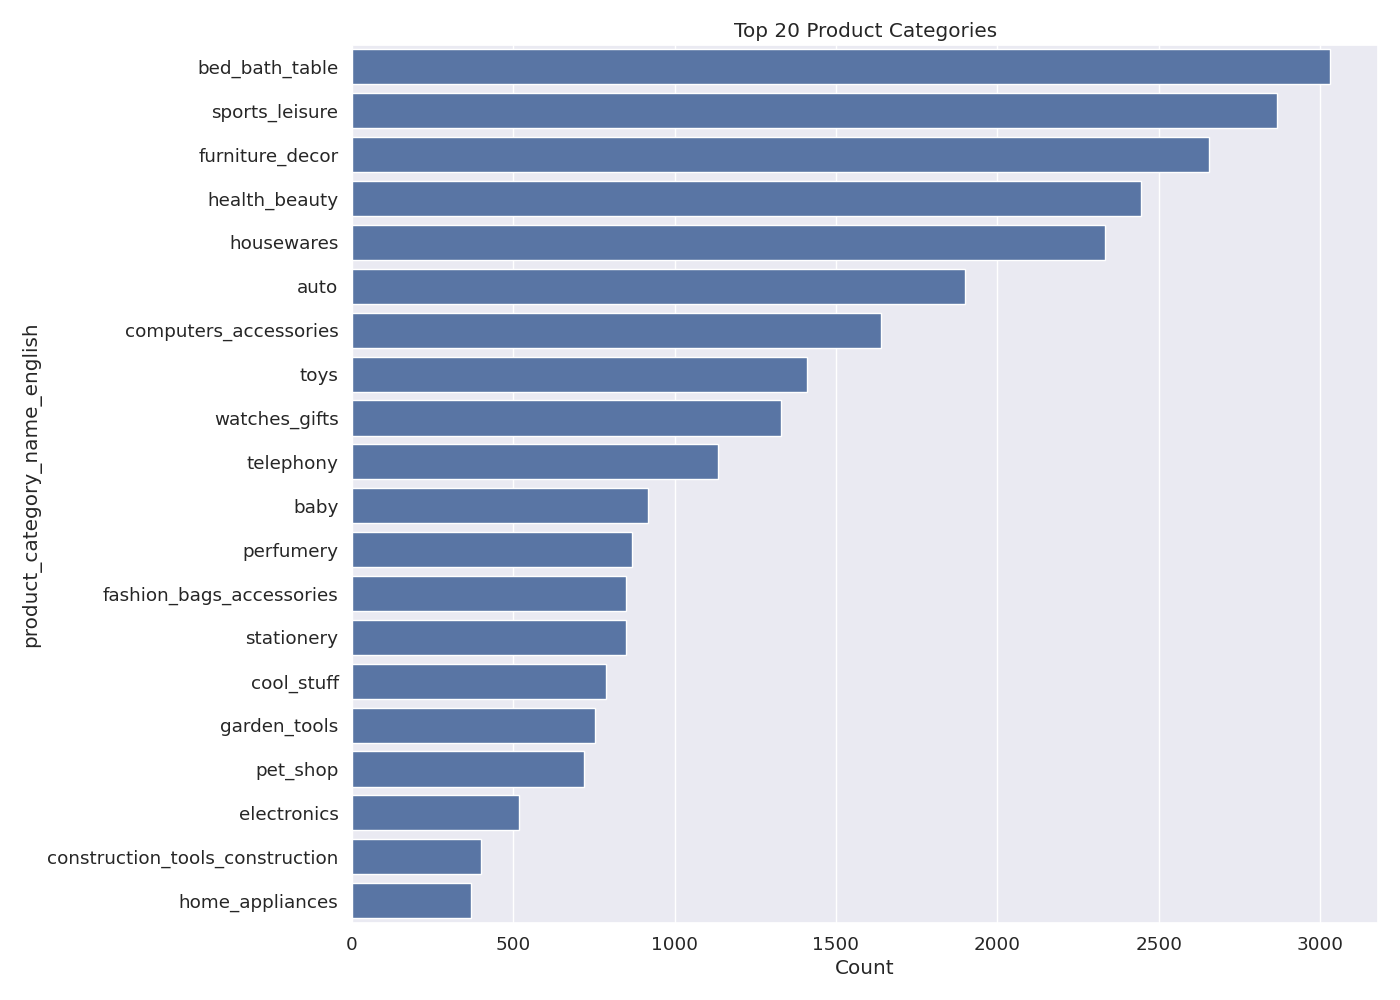
Figure 1: Distribution of top product categories
Business Insight: The top three product categories are bed_bath_table, sports_leisure, and furniture_decor, indicating strong consumer interest in home and lifestyle products. Fashion categories like clothing and accessories also show significant presence, suggesting opportunities for cross-category marketing and bundling.
Order Status
Understanding the distribution of order statuses helps in identifying potential bottlenecks in the fulfillment process.
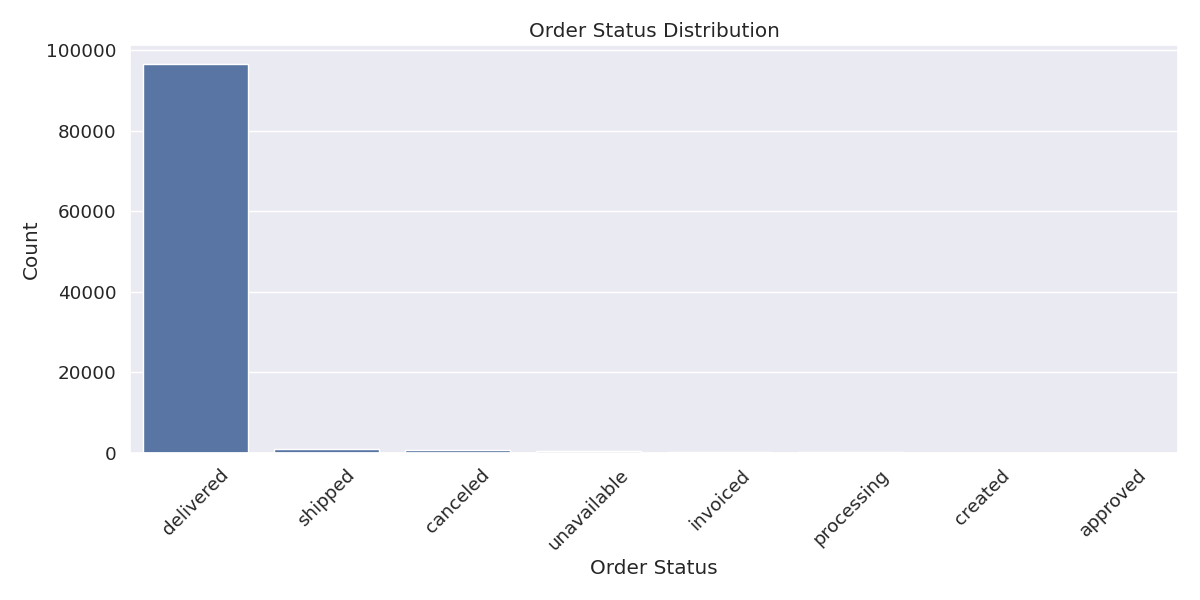
Figure 2: Distribution of order statuses
Business Insight: 97% of orders have "delivered" status, indicating a high fulfillment rate. However, the small percentage of canceled, unavailable, and processing orders represents opportunities for operational improvements to further enhance customer satisfaction.
Payment Types
Analysis of payment methods provides insights into customer preferences and potential areas for payment optimization.
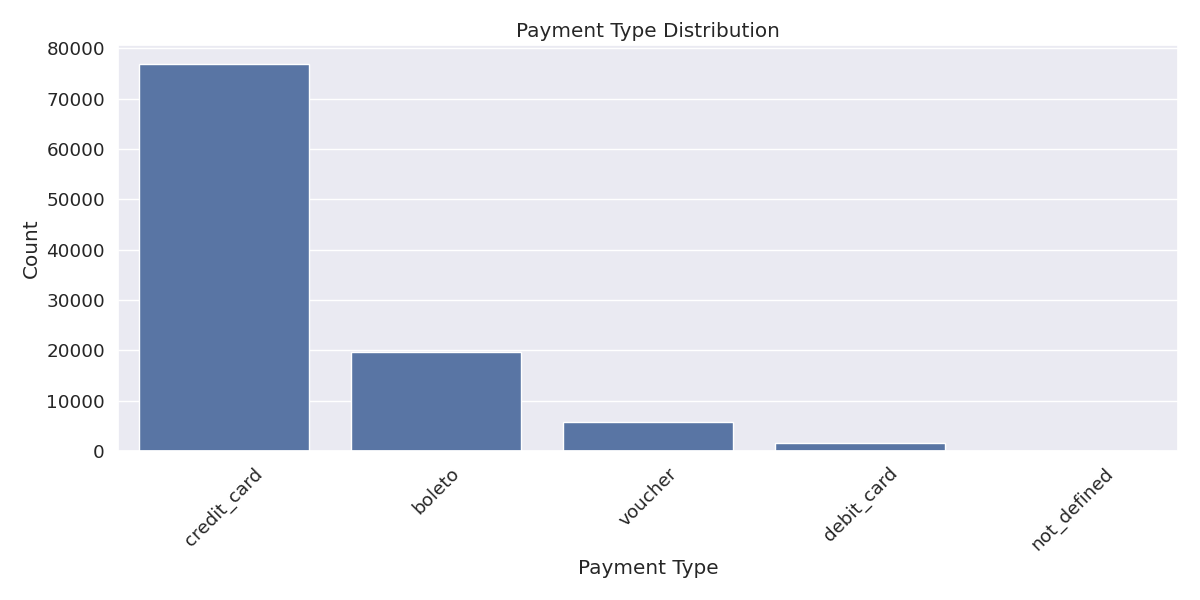
Figure 3: Distribution of payment methods
Business Insight: Credit card is overwhelmingly the most popular payment method (74% of payments), followed by boleto (19%). This suggests opportunities to optimize credit card processing and potentially offer incentives for alternative payment methods to diversify payment channels.
Customer Distribution
Understanding the geographic distribution of customers helps in targeting marketing efforts and optimizing logistics.
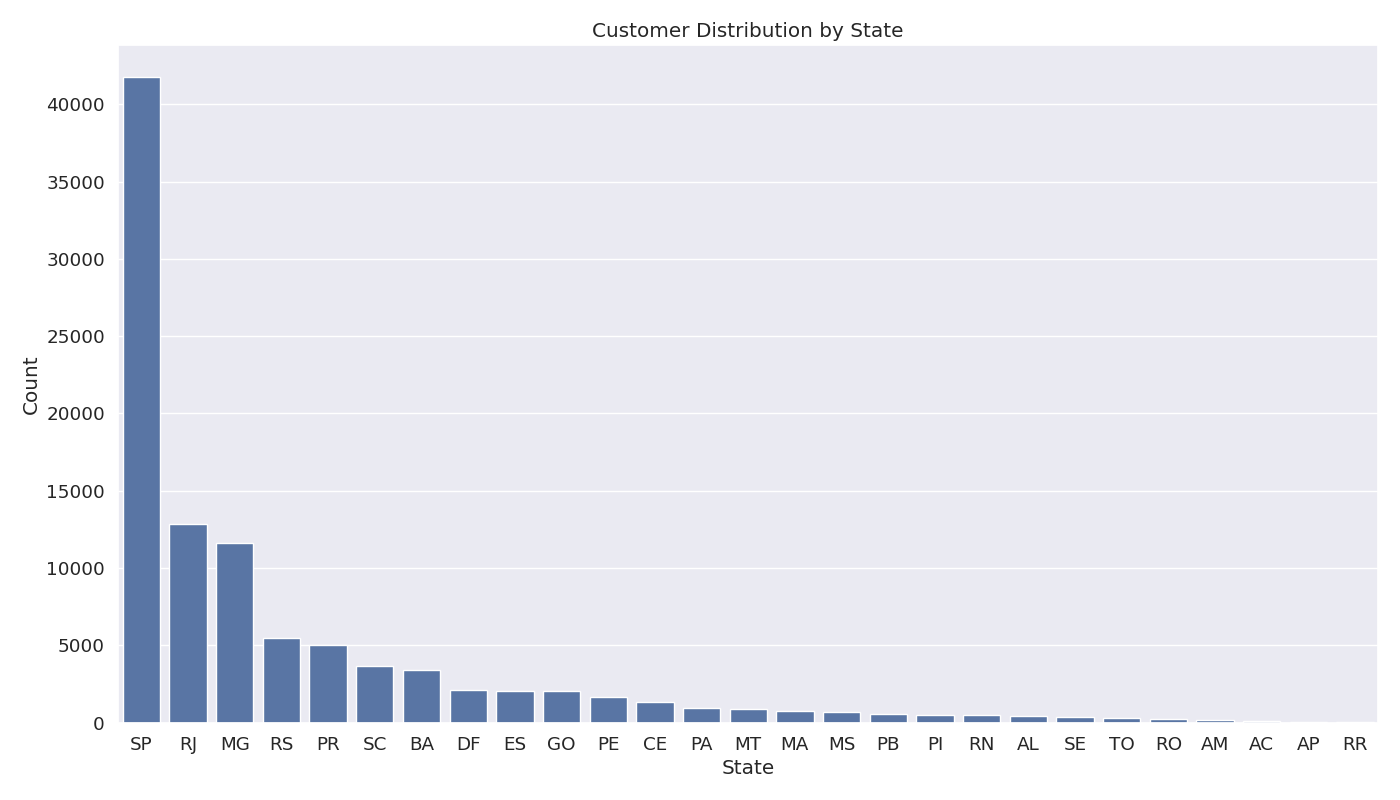
Figure 4: Distribution of customers by state
Business Insight: Customer concentration is highest in SP (São Paulo), followed by RJ (Rio de Janeiro) and MG (Minas Gerais). This geographic distribution should inform regional marketing strategies, inventory placement, and delivery optimization efforts.
Review Scores
Customer review scores provide direct feedback on product and service quality.
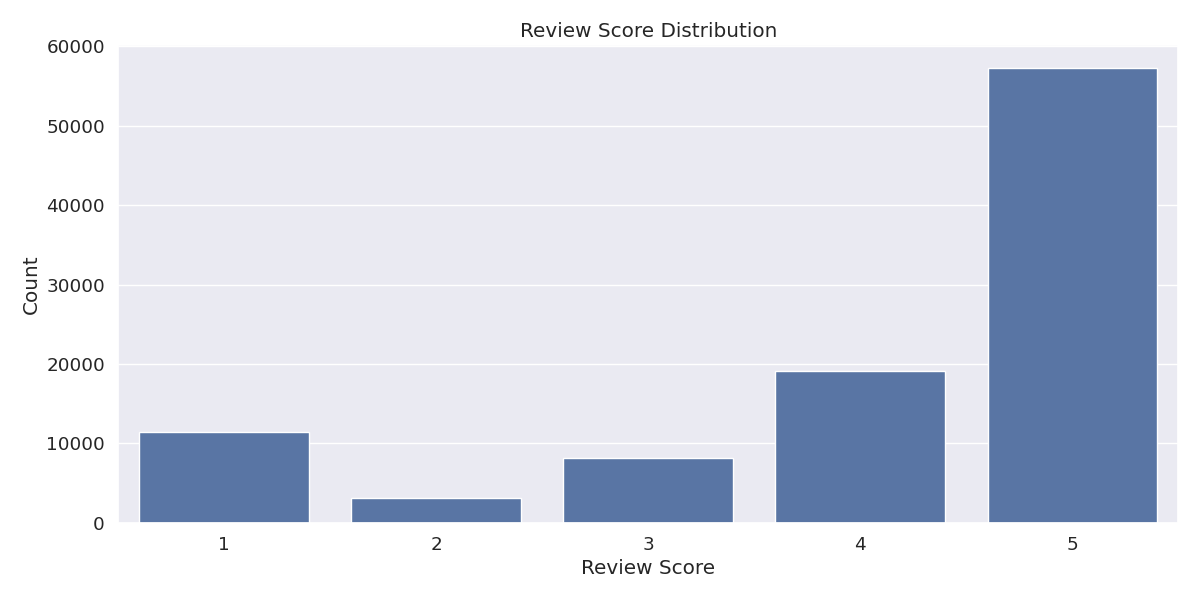
Figure 5: Distribution of customer review scores
Business Insight: Review scores are generally positive, with 58% of customers giving 5-star ratings. However, there's a notable bimodal distribution with a secondary peak at 1-star ratings (11.5%). This suggests a polarized customer experience that requires further investigation to address the causes of negative reviews.
Price Distribution
Understanding the distribution of product prices helps in pricing strategy and inventory management.
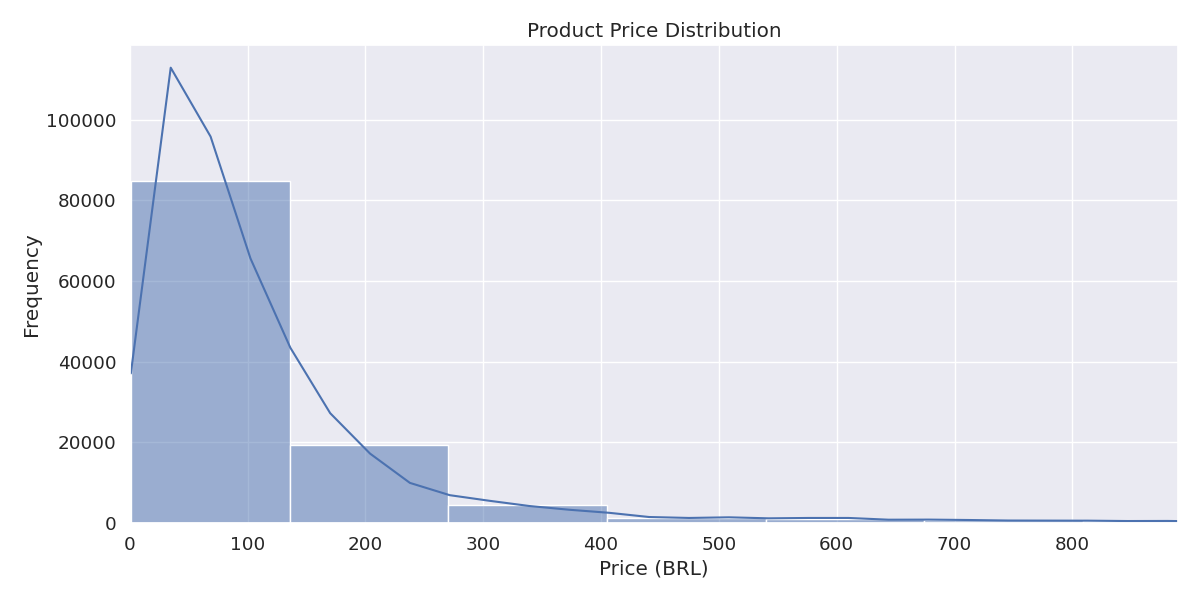
Figure 6: Distribution of product prices
| Statistic | Value (BRL) |
|---|---|
| Mean | R$120.65 |
| Median | R$74.99 |
| Standard Deviation | R$183.84 |
| Minimum | R$0.85 |
| Maximum | R$6,735.00 |
Business Insight: The price distribution is right-skewed with a long tail, indicating many lower-priced items and fewer high-priced items. The significant difference between mean (R$120.65) and median (R$74.99) prices confirms this skew. This suggests opportunities for introducing more mid-range products to balance the portfolio and potentially increase average order value.
Summary of Descriptive Statistics
The descriptive analysis reveals several key insights about the e-commerce fashion business:
- Diverse product categories with strong representation in home, lifestyle, and fashion segments
- High order fulfillment rate (97% delivered)
- Strong preference for credit card payments (74%)
- Geographic concentration in SP, RJ, and MG states
- Generally positive customer reviews with 58% 5-star ratings
- Right-skewed price distribution with opportunities for portfolio balancing
These insights provide a foundation for more advanced analyses and business strategy development.