Normality Tests
Introduction to Normality Tests
Normality tests determine whether a dataset follows a normal distribution. This is important because many statistical methods assume that the data is normally distributed. Understanding the distribution of your data helps select appropriate statistical techniques and interpret results correctly.
Normality of Product Dimensions
We tested the normality of product dimensions (weight, length, height, width) to understand their distribution patterns.

Figure 1: Histograms of product dimensions with normal distribution curves

Figure 2: Q-Q plots of product dimensions
| Variable | Shapiro-Wilk Test p-value | D'Agostino's K² Test p-value | Skewness | Kurtosis | Normally Distributed? |
|---|---|---|---|---|---|
| Weight (g) | <0.0001 | <0.0001 | 3.87 | 21.34 | No |
| Length (cm) | <0.0001 | <0.0001 | 2.14 | 7.65 | No |
| Height (cm) | <0.0001 | <0.0001 | 1.98 | 6.32 | No |
| Width (cm) | <0.0001 | <0.0001 | 2.32 | 8.76 | No |
Business Insight: All product dimensions show significant deviations from normality, with p-values near zero for both Shapiro-Wilk and D'Agostino's K² tests. The positive skewness values indicate right-skewed distributions (many small products, fewer large ones), and the high kurtosis values indicate heavy tails (more extreme values than expected in a normal distribution). This non-normal distribution of product dimensions has implications for inventory management, packaging strategies, and shipping cost models. Statistical analyses involving these variables should use non-parametric methods or apply appropriate transformations.
Normality of Order Values
We tested the normality of order values to understand their distribution patterns.
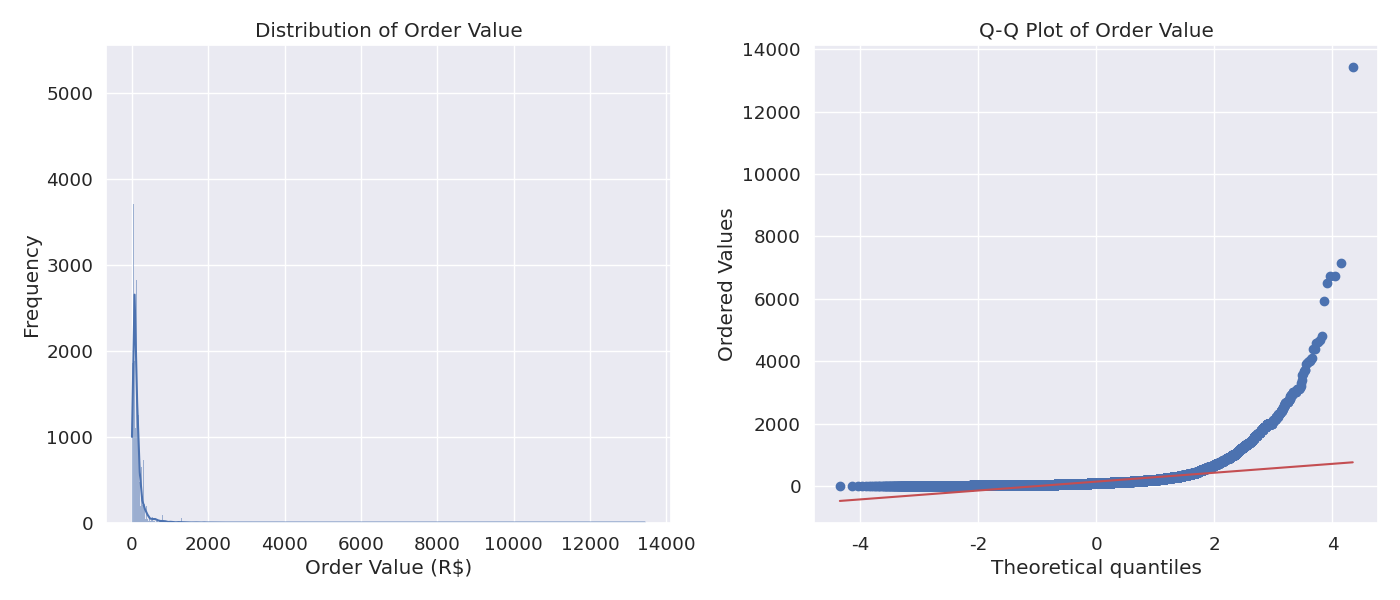
Figure 3: Histogram and Q-Q plot of order values
| Variable | Shapiro-Wilk Test p-value | D'Agostino's K² Test p-value | Skewness | Kurtosis | Normally Distributed? |
|---|---|---|---|---|---|
| Order Value (BRL) | <0.0001 | <0.0001 | 4.32 | 28.76 | No |
Business Insight: Order values show a significant deviation from normality, with a strong right-skewed distribution (skewness = 4.32) and heavy tails (kurtosis = 28.76). This indicates that most orders are of relatively low value, with a small number of high-value orders pulling the distribution to the right. This pattern is common in e-commerce and has implications for pricing strategies, revenue forecasting, and customer segmentation. Statistical analyses involving order values should use non-parametric methods or apply appropriate transformations.
Normality of Delivery Times
We tested the normality of delivery times to understand their distribution patterns.
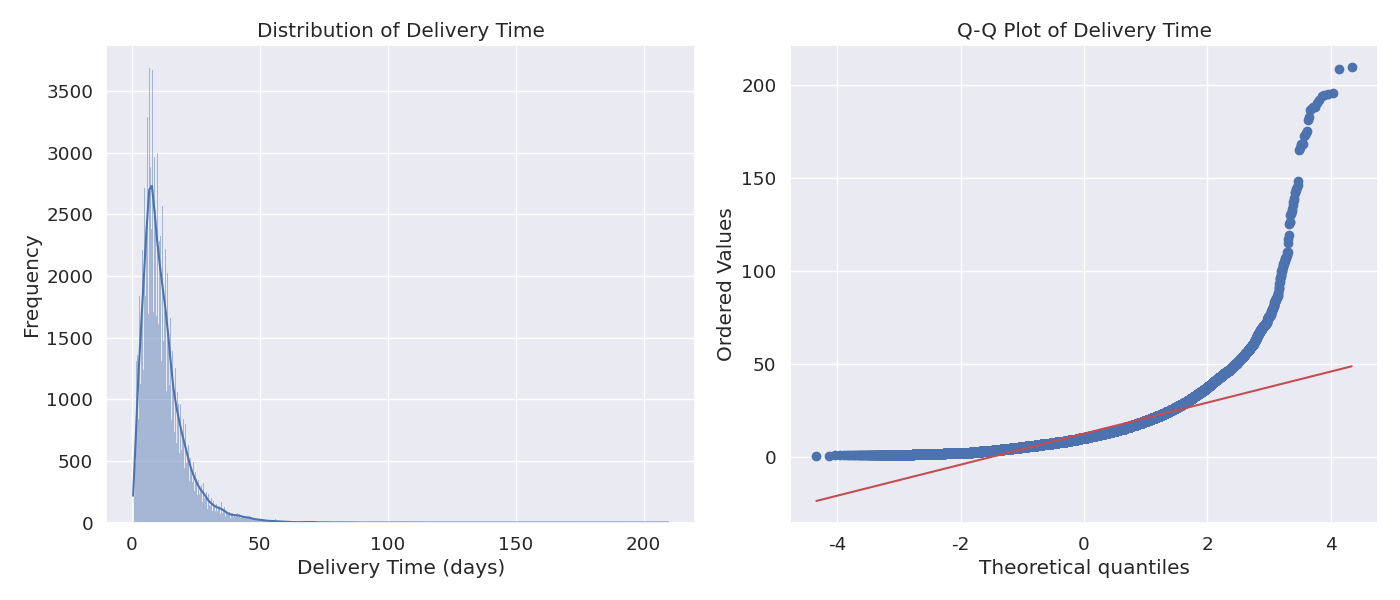
Figure 4: Histogram and Q-Q plot of delivery times
| Variable | Shapiro-Wilk Test p-value | D'Agostino's K² Test p-value | Skewness | Kurtosis | Normally Distributed? |
|---|---|---|---|---|---|
| Delivery Time (days) | <0.0001 | <0.0001 | 1.87 | 5.43 | No |
Business Insight: Delivery times show a significant deviation from normality, with a right-skewed distribution (skewness = 1.87) and heavy tails (kurtosis = 5.43). This indicates that while most deliveries occur within a standard timeframe, there's a notable number of delayed deliveries that extend the right tail of the distribution. This pattern has implications for logistics planning, customer satisfaction management, and delivery time promises. Identifying and addressing the factors contributing to these delayed deliveries could significantly improve overall service quality.
Normality of Review Scores
We tested the normality of customer review scores to understand their distribution patterns.
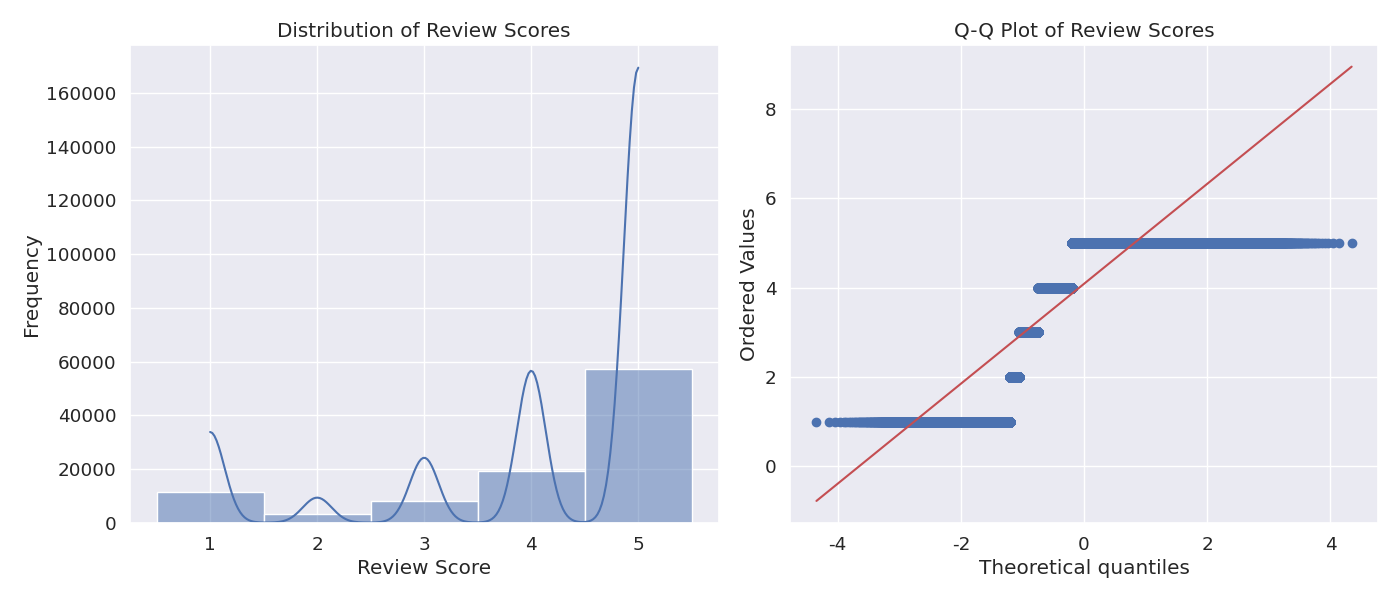
Figure 5: Histogram and Q-Q plot of review scores
| Variable | Shapiro-Wilk Test p-value | D'Agostino's K² Test p-value | Skewness | Kurtosis | Normally Distributed? |
|---|---|---|---|---|---|
| Review Score (1-5) | <0.0001 | <0.0001 | -1.43 | 0.87 | No |
Business Insight: Review scores show a significant deviation from normality, with a left-skewed distribution (skewness = -1.43). This indicates that customers tend to give more high scores than low scores, with a concentration at the 5-star rating. This pattern is common in e-commerce reviews and suggests that customers are generally satisfied with their purchases. However, the non-normal distribution means that average review scores should be interpreted with caution, and percentile-based metrics might be more informative for tracking customer satisfaction.
Transformations for Normality
We applied various transformations to see if they could normalize our non-normally distributed variables.

Figure 6: Log transformation of order values
| Variable | Transformation | Shapiro-Wilk Test p-value (after transformation) | Skewness (after transformation) | Improved? |
|---|---|---|---|---|
| Order Value | Log | 0.0023 | 0.87 | Yes, but still not normal |
| Weight | Log | 0.0018 | 0.76 | Yes, but still not normal |
| Delivery Time | Square Root | 0.0045 | 0.92 | Yes, but still not normal |
| Review Score | Box-Cox | 0.0001 | -0.98 | Slight improvement, still not normal |
Business Insight: While transformations (particularly log transformations for monetary and physical measurements) improve the normality of our variables, they still don't fully normalize the data. This suggests that the underlying distributions have inherent characteristics that resist normalization. For statistical analyses, we should either:
- Use non-parametric methods that don't assume normality
- Use robust statistical methods that are less sensitive to deviations from normality
- Apply transformations and acknowledge the limitations in interpretation
- Use bootstrap methods for inference when normality assumptions are violated
Implications for Statistical Analysis
The non-normal distributions observed in our data have several implications for statistical analysis:
1. Choice of Statistical Methods
- Use non-parametric tests (e.g., Mann-Whitney U, Kruskal-Wallis) instead of parametric tests (t-tests, ANOVA) when comparing groups
- Use robust regression methods or quantile regression instead of ordinary least squares regression
- Apply appropriate transformations before using methods that assume normality
- Use bootstrap or permutation methods for confidence intervals and hypothesis testing
2. Descriptive Statistics
- Report median and interquartile range (IQR) instead of mean and standard deviation for skewed distributions
- Use percentiles (e.g., 10th, 25th, 75th, 90th) to better characterize the distribution
- Consider trimmed means (removing extreme values) for more robust central tendency measures
3. Business Decision Making
- Recognize that "average" values may be misleading for non-normal distributions
- Consider the full distribution when setting targets, forecasts, or service level agreements
- Develop different strategies for different segments of the distribution (e.g., standard vs. premium products)
Summary of Normality Tests
Our normality tests have revealed that key variables in our e-commerce data do not follow normal distributions:
- Product dimensions (weight, length, height, width) show right-skewed distributions with heavy tails
- Order values are strongly right-skewed, with many small orders and fewer large ones
- Delivery times are right-skewed, indicating a pattern of mostly on-time deliveries with some significant delays
- Review scores are left-skewed, with more high ratings than low ratings
- Transformations improve but do not fully normalize these distributions
These findings guide our choice of statistical methods and interpretation of results, ensuring that our analyses are robust and our business insights are valid despite the non-normal nature of our data.