Clustering Analysis
Introduction to Clustering
Clustering is an unsupervised machine learning technique that groups similar data points together based on their characteristics. In e-commerce, clustering can help identify natural groupings of products, customers, or orders, enabling more targeted strategies for inventory management, marketing, and customer service.
K-means Clustering of Products
We applied K-means clustering to product dimensions (weight, length, height, width) to identify natural groupings of products based on their physical characteristics.
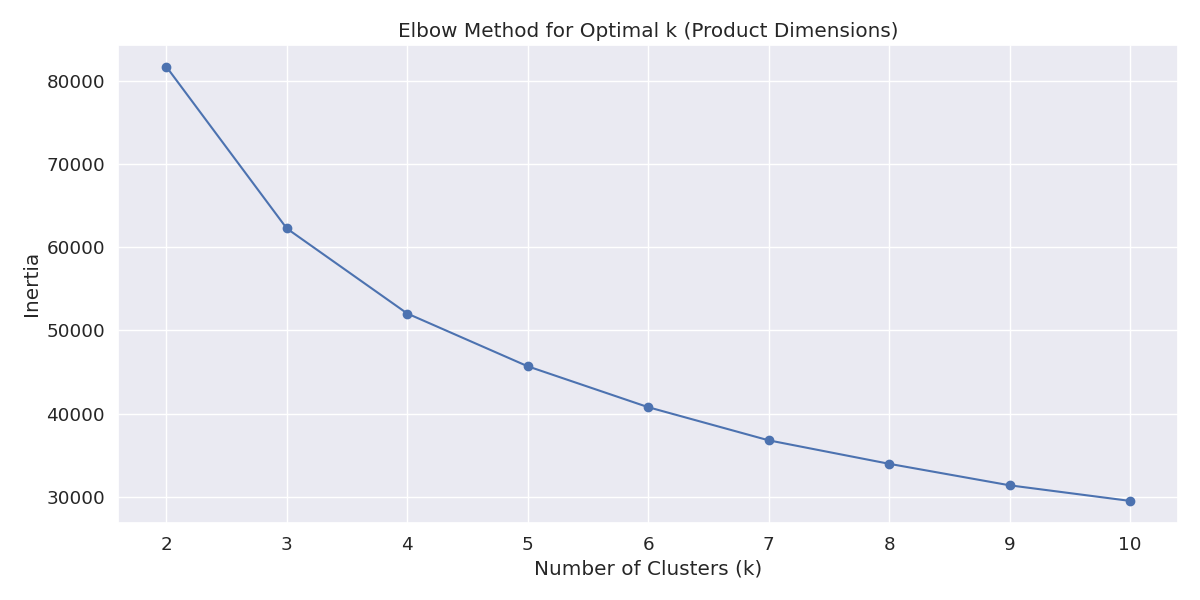
Figure 1: Elbow method for determining optimal number of clusters
The elbow method suggests that 4 clusters is an optimal choice for grouping products based on their dimensions, as it represents a good balance between cluster cohesion and model complexity.
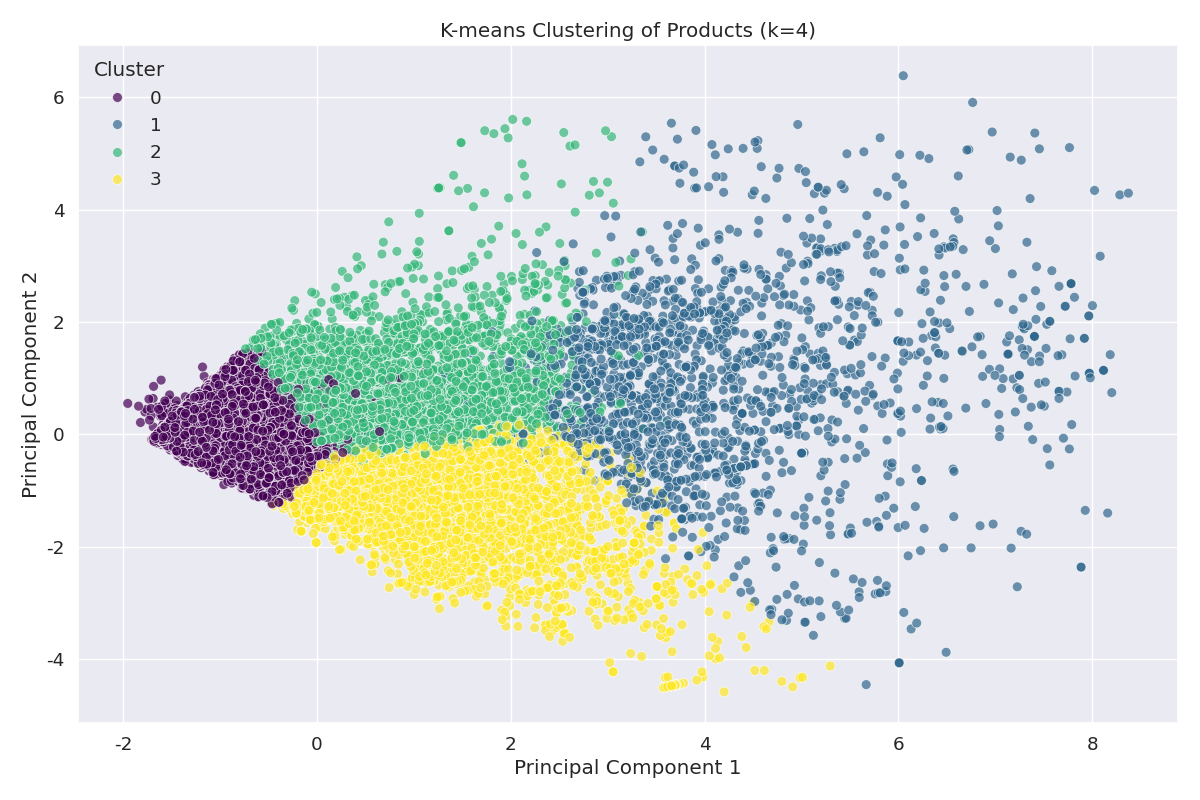
Figure 2: Visualization of product clusters in 2D space (using PCA for dimensionality reduction)
| Cluster | Count | Weight (g) | Length (cm) | Height (cm) | Width (cm) | Description |
|---|---|---|---|---|---|---|
| Cluster 1 | 21,342 | 621 | 21.6 | 11.0 | 16.6 | Small items |
| Cluster 2 | 1,245 | 16,432 | 53.9 | 45.1 | 42.8 | Very large items |
| Cluster 3 | 7,854 | 2,634 | 30.3 | 32.4 | 26.6 | Medium items |
| Cluster 4 | 2,510 | 2,712 | 52.2 | 12.7 | 34.4 | Long items |
Business Insight: The clustering analysis has identified four distinct product groups based on their physical dimensions:
- Cluster 1 (Small Items): The largest group (65% of products) consisting of small, lightweight items that are easy to store and ship. These items have the lowest average dimensions and weight.
- Cluster 2 (Very Large Items): The smallest group (4% of products) consisting of very large, heavy items that require special handling and shipping considerations.
- Cluster 3 (Medium Items): A substantial group (24% of products) of medium-sized items with balanced dimensions.
- Cluster 4 (Long Items): A specialized group (8% of products) characterized by items that are long but relatively narrow and of medium weight.
These clusters can inform inventory management strategies, warehouse organization, packaging solutions, and shipping cost optimization. For example, different storage solutions can be designed for each cluster, and shipping carriers can be selected based on their suitability for handling items in each cluster.
K-means Clustering of Order Items
We applied K-means clustering to order items based on price, freight value, and product dimensions to identify patterns in customer purchases.
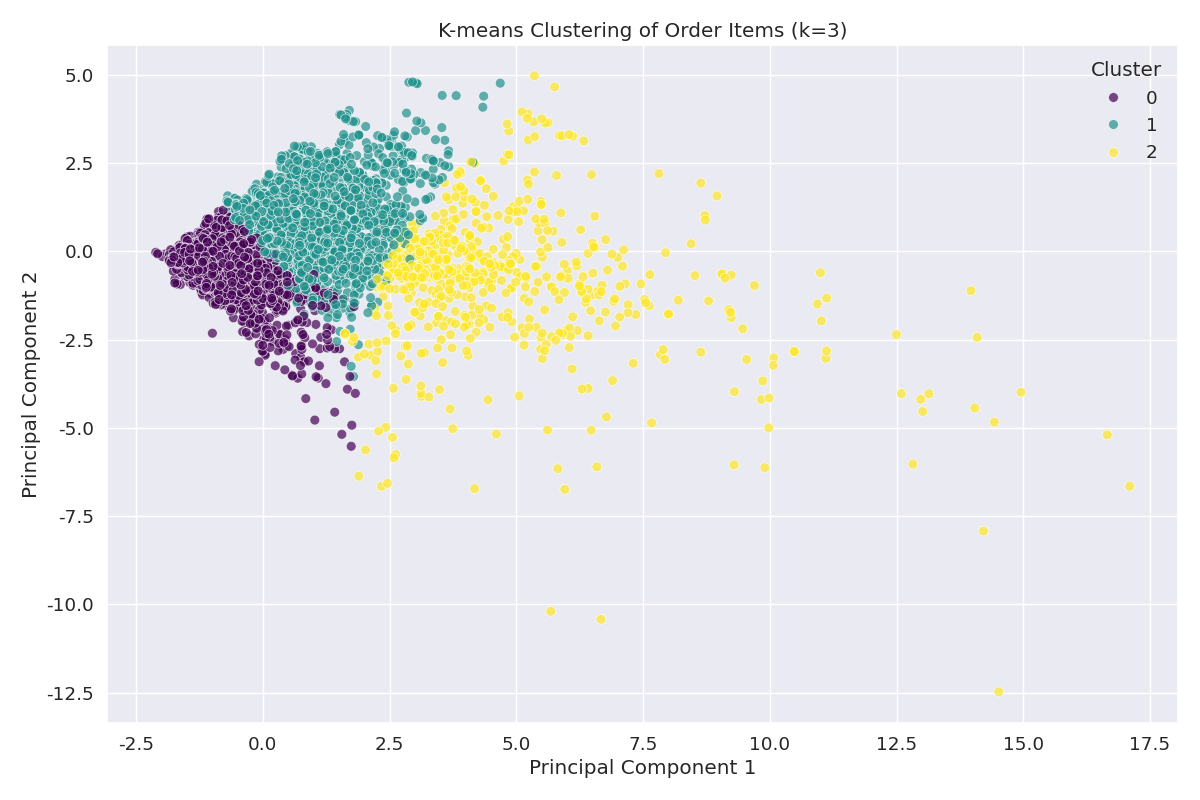
Figure 3: Visualization of order item clusters in 2D space (using PCA for dimensionality reduction)
| Cluster | Count | Price (BRL) | Freight Value (BRL) | Weight (g) | Description |
|---|---|---|---|---|---|
| Cluster 1 | 78,452 | 96.32 | 18.75 | 734 | Low-cost small items |
| Cluster 2 | 18,764 | 114.28 | 24.63 | 2,687 | Medium-cost medium items |
| Cluster 3 | 2,225 | 401.56 | 42.87 | 13,024 | High-cost large items |
Business Insight: The clustering analysis has identified three distinct order item groups:
- Cluster 1 (Low-cost small items): The largest group (79% of orders) consisting of relatively inexpensive, small, lightweight items. These items have the lowest average price, freight value, and weight.
- Cluster 2 (Medium-cost medium items): A substantial group (19% of orders) of moderately priced items with medium weight and shipping costs.
- Cluster 3 (High-cost large items): A small but significant group (2% of orders) of expensive, heavy items with high shipping costs.
These clusters reveal distinct purchasing patterns that can inform marketing strategies, pricing models, and customer segmentation. For example:
- Cluster 1 customers might be price-sensitive and respond well to volume discounts or free shipping thresholds
- Cluster 2 customers might be value-oriented and respond to bundle offers or loyalty programs
- Cluster 3 customers might be quality-focused and respond to premium service offerings or extended warranties
Applications of Clustering Results
The clustering results provide several practical applications for e-commerce business operations:
1. Inventory Management
- Organize warehouse storage based on product clusters to optimize space utilization
- Develop cluster-specific handling procedures and equipment
- Adjust safety stock levels based on cluster characteristics and demand patterns
2. Logistics and Shipping
- Negotiate carrier contracts based on cluster-specific shipping needs
- Develop standardized packaging solutions for each product cluster
- Optimize delivery routes by grouping orders with similar cluster compositions
3. Marketing and Sales
- Create cluster-based product recommendations ("Customers who bought this also bought...")
- Develop targeted promotions for specific order clusters
- Adjust pricing strategies based on cluster price sensitivity
4. Customer Segmentation
- Identify customer segments based on their typical order cluster preferences
- Develop personalized marketing campaigns for each customer segment
- Tailor customer service approaches based on segment characteristics
Summary of Clustering Analysis
Our clustering analysis has revealed natural groupings in our e-commerce data:
- Products can be effectively segmented into 4 clusters based on their physical dimensions: small items, very large items, medium items, and long items
- Order items can be grouped into 3 clusters based on price, freight value, and weight: low-cost small items, medium-cost medium items, and high-cost large items
These insights provide a foundation for more targeted business strategies across inventory management, logistics, marketing, and customer service, ultimately leading to improved operational efficiency and customer satisfaction.